Health Care
Tying Rep Activity to Revenue Outcomes in HubSpot
Simple Strat built a HubSpot Dataset using Users, Contacts, and Activities with a custom DATEDIFF formula to give a healthcare client accurate, per-specialist visibility into the calls and meetings it takes to convert a patient.

The Challenge
Leadership had a straightforward question: how many calls and meetings does it take to convert a patient, and how does that compare across the enrollment team? Getting a reliable answer was anything but straightforward.
The client's sales process is more complex than a standard pipeline. Multiple leads can exist for a single contact, either because of disqualification and new lead creation, or because leads are also used to represent children within a family. As a result, lifecycle stages and stage dates only capture part of the picture. Meeting and email activity only surface part of the detail. Standard reports built off individual objects couldn't account for both the right records and the right timeframes at once. Leadership needed to see activity by specialist, but only for contacts who actually became patients, and only for the activities that happened before the payment date.
The data existed in HubSpot, but there was no report that could pull it together accurately.
The Solution
Custom reports built from individual objects hit a wall quickly, both in terms of combining different object types and filtering that data with enough precision. That's where Datasets came in, built specifically for the kind of cross-object, conditional reporting this question required.
The Setup
The Dataset was built with Users as the primary source, then layered in Contacts connected to those users, and Activities connected to those contacts. That structure made it possible to view activity at the specialist level rather than starting from contacts or deals. Lifecycle stage filters narrowed the contact population to those who actually converted to patients.
The Engine
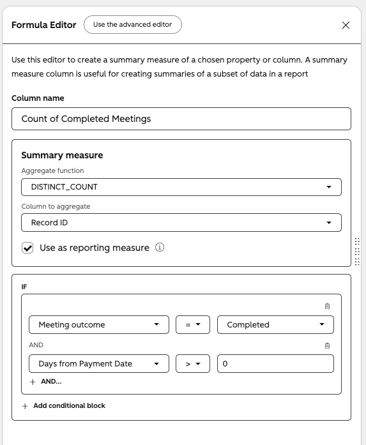
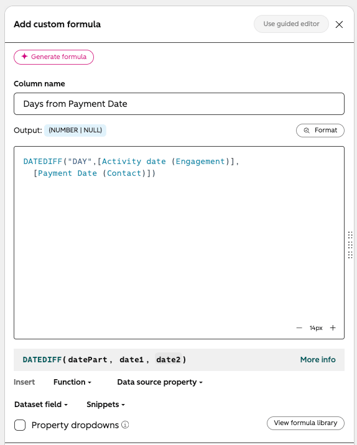
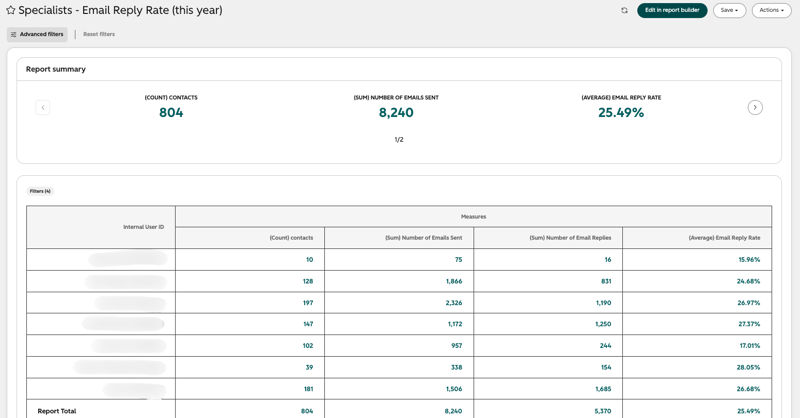
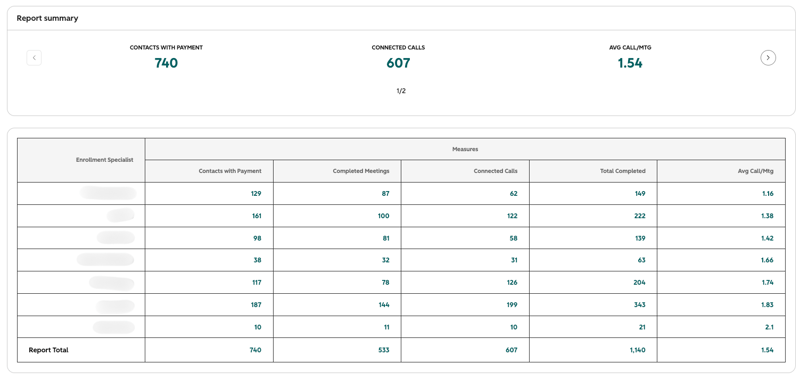
The harder problem was filtering activities to only those that occurred before each contact's payment date. HubSpot's standard filtering doesn't support "date is before another property" the way Segments do, so a custom DATEDIFF formula was built as a calculated column: the difference in days between the Activity Date and the Contact Payment Date. A dataset filter then excluded any activities where that value was zero or below, leaving only the activities that happened before payment. From there, two reports were built off the dataset: one showing completed meetings, connected calls, and average call and meeting volume per converting patient by specialist, and a second showing per-specialist email reply rates for those same converting patients.
The Impact
Across the team, the average came out to 1.53 calls and meetings per converted patient, with a 25.49% email reply rate.
Those numbers existed in HubSpot the whole time, but were never visible in a way anyone could trust. Leadership now has an accurate, per-specialist view of what it actually takes to convert a patient, broken down by completed meetings, connected calls, and email engagement. The reporting holds up even given the complexity of the client's lead structure, because the Dataset filters to exactly the right records and exactly the right timeframe for each one.

FAQ
What are HubSpot Datasets and when should you use them for reporting?
Datasets let you define a reusable data structure across multiple objects and apply calculated columns and filters before a report is ever built, which makes them the right tool when standard reports can't combine or filter the data you need.
Standard HubSpot reports work well when the data you need lives on one object or follows a straightforward relationship. When you need to join Users, Contacts, and Activities, apply date-based calculations, and filter on conditions that cross object boundaries, standard reports hit their limits quickly. The custom report builder also caps formula fields at five, which becomes a constraint faster than you'd expect on complex reporting builds. Datasets allow up to 25 calculated columns, so the logic has room to grow without requiring a workaround. Datasets let you define the structure, relationships, and logic once, then build multiple reports on top of that foundation without rebuilding the logic each time. As a HubSpot Diamond Solutions Partner, Simple Strat recommends Datasets when the reporting question requires precision that single-object reports can't deliver.
How do you filter HubSpot Activities to only show those that happened before a specific date on a related record?
Build a DATEDIFF formula as a calculated column in your Dataset, then apply a filter to exclude any activities where the result is zero or negative.
HubSpot's native filtering doesn't support comparing one date property to another property's date the way Segments do. Inside a Dataset, you can work around this by creating a calculated column that computes the difference in days between the two dates using DATEDIFF. For activity-before-payment filtering, the formula computes the gap between the Activity Date and the Contact Payment Date. Filtering the dataset to only include rows where that value is greater than zero leaves only the activities that occurred before payment. It's a reliable workaround for a filtering gap that would otherwise make this kind of analysis impossible in standard reports. Simple Strat applies this approach when date-based cross-property filtering is needed in reporting builds.
How do you report on rep activity in HubSpot when your lead structure doesn't map cleanly to lifecycle stages?
Start the Dataset from the User object rather than Contacts or Deals, so the report is structured around the specialist first and the associated contacts and activities flow from there.
When a contact can have multiple leads, represent multiple family members, or move through disqualification and re-entry, lifecycle stage dates alone don't tell the full story. Building the Dataset with Users as the primary source changes the structure of the report: instead of starting from contacts and trying to attribute them to a rep, you start from the rep and pull in the contacts and activities connected to them. Combined with filters that limit the contact population to those who converted and activities to those that occurred before conversion, the result is a report that accurately reflects what each specialist did to earn each outcome, regardless of how complex the underlying lead structure is.